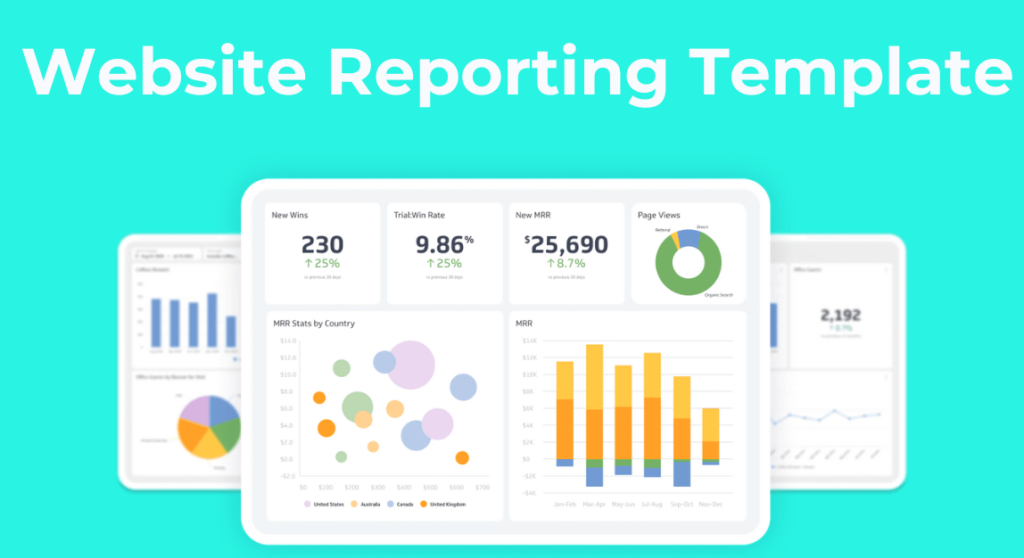
Website Report Template
Data is everywhere in our modern world, and using conventional storing and displaying it could lead you astray. You have a lot of data to manage if you manage marketing campaigns across various channels. Keep it all in one place, show it in any way you want, and get a quick overview of how your marketing initiatives are doing. However, Website Reporting offers previously unheard-of benefits due to advancements in information technology and the introduction of the browser concept. Continue reading to learn about website reporting templates’ definitions, significance, and use.
Here’s the link for the Website reporting template that will help you easily understand.
What Is Website Reporting?
The procedure of gathering and analyzing website data is known as website reporting. This procedure might also be used as a technique to increase the efficiency of websites. You can use website reporting to examine the origin of free and paid traffic and bounce rates. Web analytics is a great tool for performing market and commercial research and is beneficial for calculating traffic. The monitoring and measurement of visitor data must be done consistently to maximize web usage effectively.
Why Create A Web Analytics Report Template?
Marketers and agency owners don’t merely assess a website’s visual quality. At least one paid search is carried out when A website’s digital marketing campaigns are created. Then the data from the marketing campaigns are performed, and ultimately data is tracked and evaluated to help design future campaigns that will be even more effective. Web reporting does not have to be challenging. It must be convenient so that you may generate great marketing performance reports and utilize your analytics data.
You may learn more about how website users and visitors engage with your site by their behaviour. In addition, you’ll better understand how to enhance customer interaction on any eCommerce website.
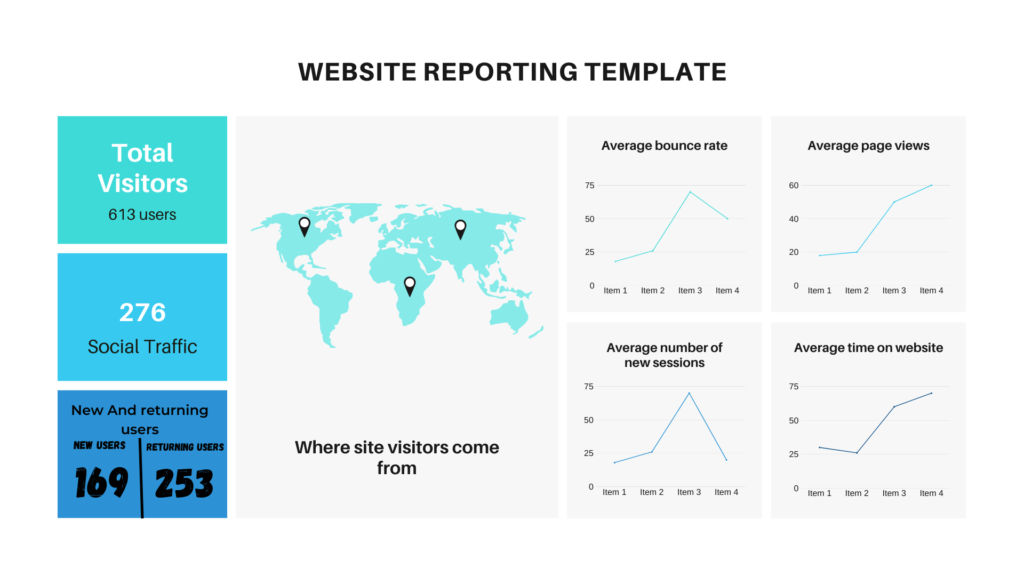
Website Reporting Template
A website reporting template creates a high-level report on website bugs, features, and supports requests.
Visitors
The number of visitors in your website is an important indicator for determining the size of your audience. Any change, including growth and decline, will be simple to spot, enabling rapid advancements. Your website may receive both new and returning visitors. The number of new visitors is the total number of visitors to your website in a certain time frame. People who had visited the website before and returned are considered returning visitors.
Traffic Source
Traffic source refers to the users who unknowingly find your website while browsing another blog, website, or social networking platform. Knowing your traffic source is crucial since it may indicate a potential joint venture for your business. The focus should be on ensuring you receive traffic from all sources, even though, depending on your business type, you might receive more traffic from one source. It can happen with a clear call to action and quality content.
Location And Language
Where do your current active visitors come from? This is always done by country, so you can get a quick overview of your top visiting countries right away. Languages display the system languages for visitors to your site, indicating what language their device is set to.
Bounce Rate
It shows the percentage of visitors who come to your website but leave immediately without further action. The less amount of time a user spends on your website, the less likely it is that they will convert. It won’t be easy to have a bounce rate of zero. Therefore the goal is to keep it as low as possible. However, you must be able to recognize when the bounce rate is high and determine what the cause may be so you can take the necessary steps to lower that figure once more.
Exits
Exits and bounce rates are not the same things. While bounce rate concerns users who enter and immediately leave your website, exits are the number of people who viewed multiple pages of your website before leaving. Once you’ve determined the cause of such a high number, make the necessary changes to the page and observe how this affects future exits.
Average Time
The average time spent on your website is a good indicator of how engaging your content has been. A large number indicates a high level of engagement. It is useful for measuring things like website navigation. If a visitor is unable to navigate your website, they are likely to leave. However, if your website is engaging and easy to use, you will notice that a user’s reporting time on the site will increase, as will the number of pages they visit.
Conversion Rate
Lastly, this is the most important step to include in your template because it will tell you if you are on track to meet your objectives. The conversion rate indicates the percentage of people who completed a specific goal on your website. Goals could range from completing a purchase to navigating to a specific website page. It depends on how you calculate success at the start of your campaigns.
Conclusion
Above, I’ve attached all of the information you’ll need to understand website reporting, as well as a website reporting template. To get the most out of the content mentioned above, consider how you can use them together to interpret your data on a deeper level. I hope this helps you better understand what works and what clearly does not! You can create your own template by conducting all of the research yourself, or you can use a website reporting tool.


